NHL Playoff Odds by Points: How Teams in Your Spot Finished Since 2009-10
Pick a team or enter games played and points from the playoff line. You get every NHL team since 2009-10 that stood in the same spot, how many of them made the playoffs, and the Thanksgiving rule broken down by distance from the line.
Loading calculator…
This calculator needs JavaScript. On U.S. Thanksgiving morning, 171 of 224 teams in a playoff spot went on to make the playoffs (2009-10 to 2025-26).
Two cards, two spots in the standings
The first card belongs to the team you chose; the second, by default, to the team on the other side of the playoff line in its conference: the first team out for a team holding a spot, the last team in for a team chasing one. Each card states where that team stands in points from the line and then counts every NHL team since 2009-10 that stood in the same place: on the same side of the line, within one point of the same distance, within two games of the same number played. Each team-season is counted once, and the fraction is the number that made the playoffs out of all of them. When that closest group holds fewer than 40 teams, as it does far from the line late in a season, the window widens step by step and the card says so.
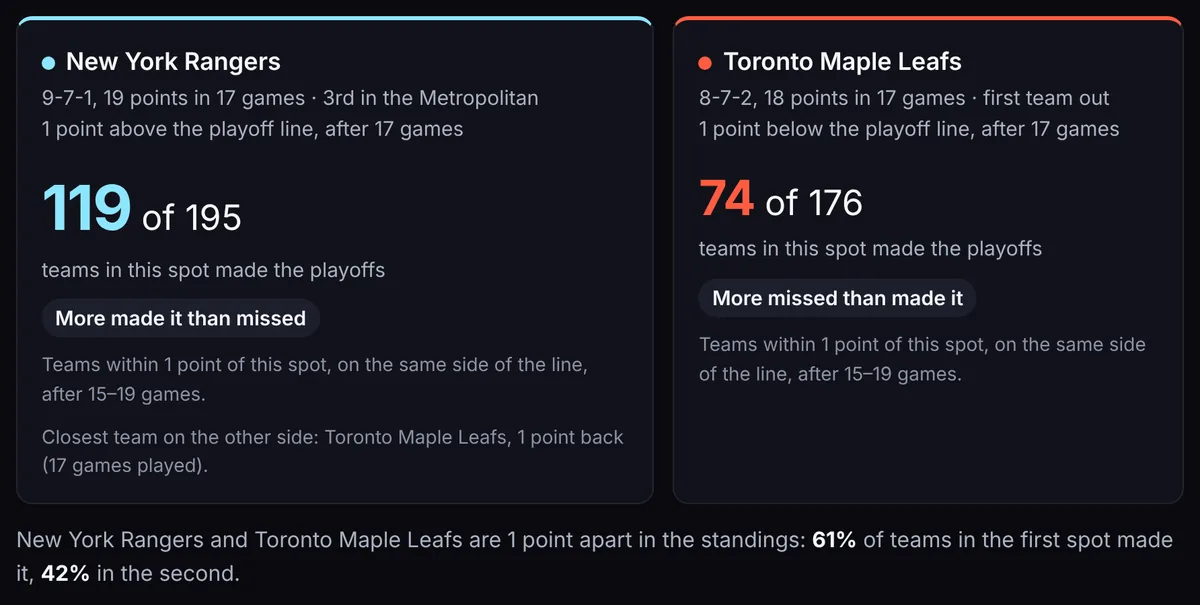
The line under the cards puts the two fractions side by side, and that is where one point shows its weight. After 21 games, teams one point inside a spot made the playoffs 101 times out of 175 (58%); teams one point outside it made it 65 times out of 156 (42%). Both groups stand one point from the same line, and the difference between them is 16 percentage points, not the difference between in and out.
A team that has played two or more games fewer than the team across the line gets a second fraction. The same search runs again with those games counted at the league rate of 1.12 points per game, the average over all 432 team-seasons in the history, so a team three points back with three games in hand is compared with teams that were effectively close to level.
The slope
The chart redraws the same count for every distance from eight points below the line to eight points above it, at your team’s number of games played. Two dots sit at zero because a team level on points with the line can be on either side of it after tiebreakers, and the curve steps up between them. Your team and the comparison team are marked on the curve, and any point on it opens its own group: how many teams stood there and how many reached the playoffs.
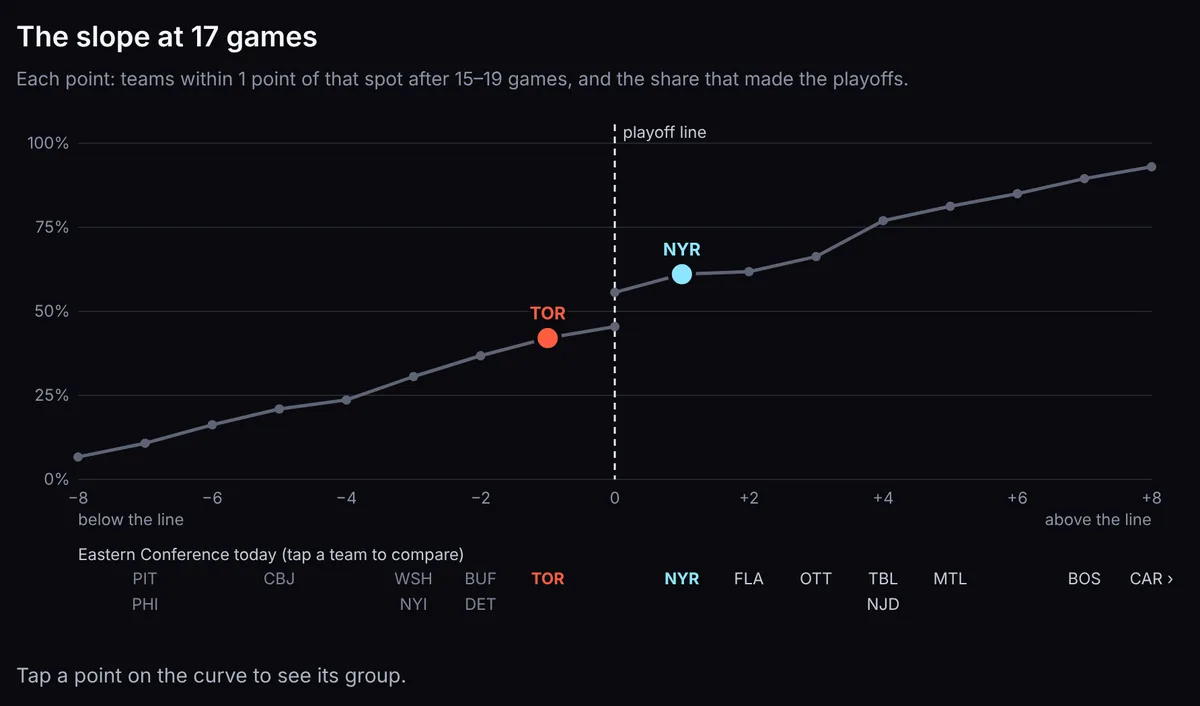
Under the curve the whole conference sits at its current distance from the line, so teams bunched within a couple of points of each other show up bunched, and a team far clear of the pack shows up alone. Choosing one of them moves it into the second card without changing the first.
Teams in the same spot, and the ones that broke the pattern
The list below the chart names the teams behind your team’s fraction, closest match first, with the season, the number of games played at the moment they matched, the distance from the line and how their season ended. The block after it looks for the opposite outcome around the same number of games: for a team holding a spot, the largest leads that still ended without the playoffs; for a team outside, the deepest holes that ended with a playoff spot. On Thanksgiving morning the largest of each were the Montréal Canadiens in 2015-16, 11 points clear of the first team out and still out of the playoffs, and the Edmonton Oilers in 2023-24, 10 points below the line and later in the Stanley Cup Final.
The Thanksgiving rule, by distance from the line
On the morning of U.S. Thanksgiving, 171 of the 224 teams holding a playoff spot went on to make the playoffs, 76.3% over 14 seasons. Season by season the counts agree with those published elsewhere: 111 of 144 over the nine wild-card seasons from 2013-14 to 2023-24, as tallied by NBC Sports Boston, and 12 of 16 in 2024-25, as in TSN’s count. The bars split that figure by distance from the line, and every team is in one of them: 4 teams over those seasons held a spot with fewer points than the first team out, or sat outside with more points than the last team in, because a third-place division team and a wild-card race are measured separately; each is counted in the nearest band, so the bars add up to 171 of 224 on one side and 53 of 208 on the other. Teams up to 2 points clear held on 47 times out of 77 (61%), teams 6 or more points clear 67 out of 71 (94%). On the other side, teams up to 2 points back still got in 34 times out of 80 (43%), and teams 6 or more back 4 times out of 62. The cards above match by games played rather than by date, so they work on any day of the season; on Thanksgiving morning teams have played about 21.4 games on average.
Where the numbers come from
Every regular-season and playoff game from 2009-10 to 2025-26 comes from the NHL’s own game feed as packaged by the sportsdataverse project. The standings are rebuilt for every morning of every season with that season’s rules: points, then games played, then the tiebreaker in force that year (wins, regulation and overtime wins, or regulation wins), then head-to-head points and goal difference; division leaders and wild cards follow the format of the time. Rebuilt this way, the final standings name all 16 playoff teams correctly in every season used. Three seasons are left out because their schedules did not run a normal course: 2012-13 (lockout, started in January), 2019-20 (stopped in March, 24-team playoff) and 2020-21 (56 games, temporary divisions). The history counts what happened to past teams; it does not know about injuries, schedules, trades or how good a team is, so a fraction here is a record of outcomes, not a forecast for this season.
Data: NHL game results via the sportsdataverse project (fastRhockey-nhl-data); standings rebuilt for every morning of every season by this page. Standings after games of November 5, 2026. Built by Vitalii C.