When Was the Last White Christmas Where You Live? Every Christmas Since 1940
The last white Christmas in New York City was 2024, with 1 inch of snow on the ground in Central Park, the first since 2009. Pick your city to see its last white Christmas, every Christmas morning since 1940, and every one since you were born.
Loading the Christmas record…
The last white Christmas and where it was measured
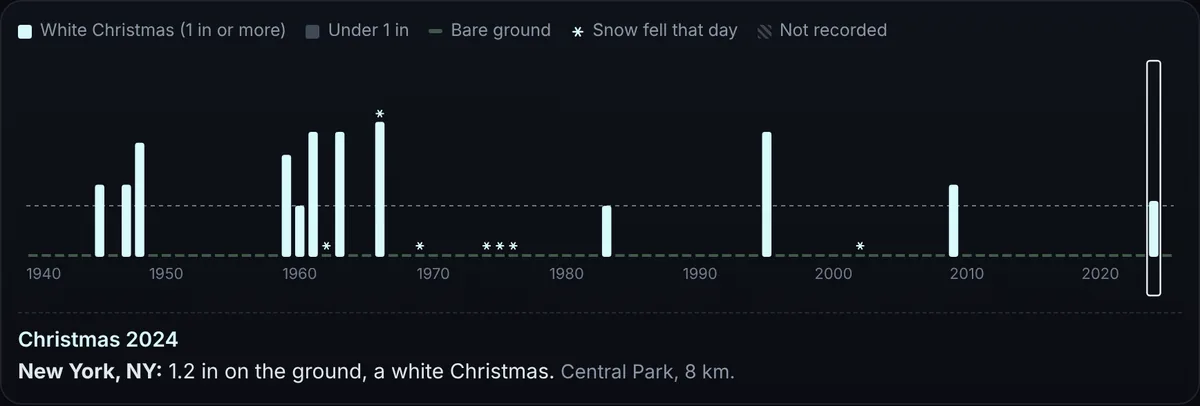
The big year at the top is the most recent Christmas with at least one inch of snow on the ground in the morning, which is how the National Weather Service defines a white Christmas. Snow that only starts falling later in the day does not count on its own. In New York the answer is 2024, with 1.2 in on the ground at Central Park, and the white Christmas before that was 2009, a gap of 15 years. The line under the answer names the station and its distance from the city center, because an airport or a park can read differently from a hillside suburb.
Every Christmas since 1940
The timeline gives each year its own column. Its height follows the snow depth on Christmas morning, the dashed line marks one inch, and the columns that cross it are the white Christmases. A small star means snow fell during the day. Hatching means no station nearby recorded the depth that year, and those years are left out of every count instead of being counted as green. New York has 12 white Christmases in 86 recorded years; in 2002, 5 in of snow fell during the day onto bare ground, so that year carries a star but stays below the line.
Runs, depth and the record behind each city
Under the timeline, the longest run of white Christmases and the longest run without one count only recorded years, so a gap in the record ends a run instead of stretching it. Tapping a row marks those years on the timeline. The depth line sorts the white Christmases into 1 to 2.9 inches, 3 to 5.9 inches and 6 inches or more, which separates a thin cover that just made the cut from a real snowpack: of 64 white Christmases in Minneapolis, 22 had 6 inches or more. The record line says how many Christmases were recorded and lists the missing years.
The Christmases you have lived through
A birth year marks the timeline and dims the years before it. Three counts follow: every Christmas since you were born, the ones between ages 3 and 12, and the last ten. Someone born in 1990 in Chicago has had 12 white Christmases out of 36 recorded, 5 of them between ages 3 and 12 and 3 in the last ten years.
Two cities on one timeline
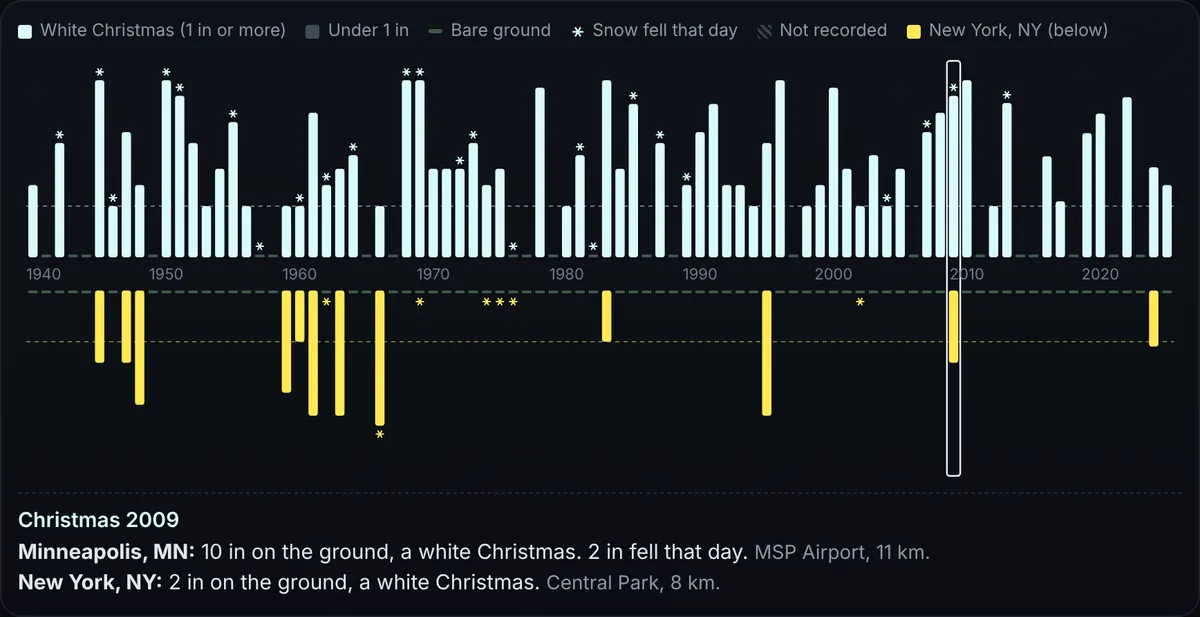
A second city is drawn in yellow below the same year axis, so every year of one city sits right above the same year of the other. The two cards give each city’s last white Christmas and its count over the last 30 recorded years, and the row under them counts the years when both cities were white. Minneapolis had 22 white Christmases in the last 30 years and New York had 2; they were white in the same year 12 times since 1940.
Last white Christmas in 25 big US cities
From the same NOAA records as the calculator above, through December 25, 2025. Any other city is in the search box.
| City | Last white Christmas | Before that | White, last 30 recorded |
|---|---|---|---|
| New York, NY | 2024 | 2009, 1995 | 2 of 30 |
| Boston, MA | 2024 | 2010, 2009 | 8 of 30 |
| Philadelphia, PA | 2009 | 1998, 1995 | 2 of 30 |
| Washington, DC | 2009 | 1989, 1966 | 1 of 30 |
| Baltimore, MD | 2009 | 1998, 1989 | 2 of 30 |
| Pittsburgh, PA | 2022 | 2020, 2017 | 7 of 30 |
| Buffalo, NY | 2024 | 2022, 2020 | 18 of 30 |
| Chicago, IL | 2022 | 2017, 2016 | 11 of 30 |
| Detroit, MI | 2022 | 2020, 2017 | 12 of 30 |
| Cleveland, OH | 2022 | 2020, 2017 | 12 of 30 |
| Columbus, OH | 2022 | 2020, 2017 | 6 of 30 |
| Cincinnati, OH | 2022 | 2017, 2010 | 6 of 30 |
| Indianapolis, IN | 2022 | 2017, 2010 | 6 of 30 |
| Milwaukee, WI | 2024 | 2022, 2017 | 14 of 30 |
| Minneapolis, MN | 2025 | 2024, 2022 | 22 of 30 |
| St. Louis, MO | 2022 | 2017, 2010 | 6 of 30 |
| Kansas City, MO | 2022 | 2017, 2013 | 9 of 30 |
| Omaha, NE | 2022 | 2020, 2017 | 11 of 30 |
| Denver, CO | 2022 | 2017, 2015 | 11 of 30 |
| Salt Lake City, UT | 2022 | 2017, 2016 | 15 of 30 |
| Seattle, WA | 2017 | 2008, 1990 | 2 of 30 |
| Portland, OR | 2017 | 2008 | 2 of 30 |
| Nashville, TN | 2010 | 1969, 1966 | 1 of 30 |
| Dallas, TX | 2009 | — | 1 of 27 |
| Atlanta, GA | None since 1940 | — | 0 of 30 |
Where the numbers come from
Every value is a daily observation from NOAA’s Global Historical Climatology Network (GHCN-Daily). Each of the 940 cities uses its official National Weather Service station where there is one, and otherwise a nearby station with a long record. When that station skipped the snow depth on December 25, the nearest station within 30 km at a similar elevation fills in, and the year shows which one. Boston is the clearest case: Logan Airport stopped reporting snow depth in 2004, so later years come from Walpole, 27 km inland, where snow lasts longer than by the harbor. Counted this way, the share of white Christmases from 1991 to 2020 in 32 large cities is within about 4 percentage points of NOAA’s published chances on average.
Built by Vitalii C.