Most Common Birthdays: Where Does Your Exact Birthday Rank?
US births by day, 1969–2014. Enter your birthday to see how many babies were born on your exact day, and what pushed that number up or down.
14,975 days of US birth records, 1969–1988 and 1994–2014. February 29 ranks 348th of 366 per occurrence; it is rare mainly because it comes once in four years.
Loading calculator…
Three answers before you type
The tiles at the top answer the question most people arrive with: September 9 is the most common birthday at +9.8% against an average day, September the busiest month at +6.4% a day, December 25 the rarest date at −30.8%. Every figure on the page is a US figure; no worldwide count of births by calendar day exists, so the page ranks no dates for the world.
The question card, then the count
With a birth year from 1969 to 1988 or from 1994 to 2014, the card asks whether more or fewer babies were born on your day than on an average day of that year; Just show me skips it. The count that follows is the number of US births registered on that exact day, with that year’s source printed under it. A year outside those ranges gets the date’s rank and an estimate for its weekday instead of a number.
Two ranks side by side
The yellow rank places your day among the days of its own year; the grey one places the date among all 366. On Wednesday, September 9, 2009, the page counts 16,081 births, the busiest day of 2009. On Sunday, September 9, 2012, it counts 7,930, 27% below an average day of 2012 and only the 290th of its 366 days. The line below the ranks gives the day before and the day after, which shows whether your birthday was a peak or a dip in its own week.
The bars
Each bar is one measured average set beside your day: your birth month, your weekday in the period closest to your year, and the holiday if the date fell on one. For a Tuesday in 1997 the weekday bar reads +15% and the September bar +6%; a Sunday from 1994 on reads −32%, a Sunday before 1989 −14%. Thanksgiving shows −26% and Christmas Day −30.8%. The bars are separate measurements and are not meant to add up to your day.
The year grid
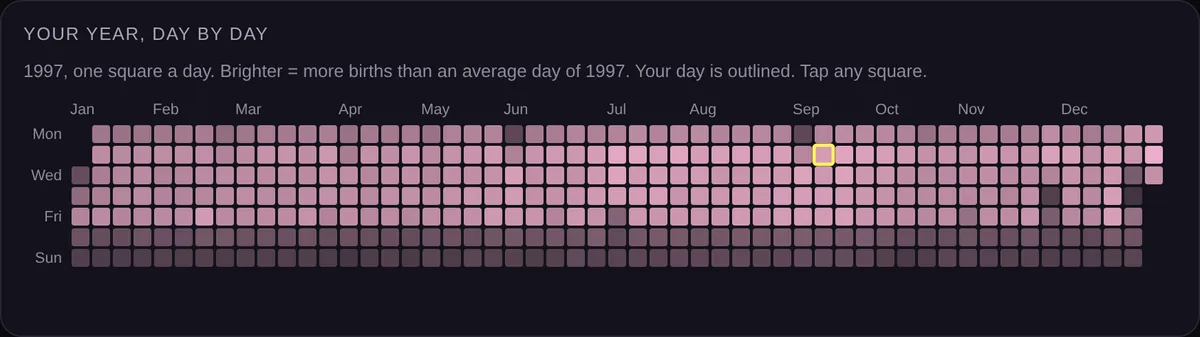
The grid draws your birth year one square per day, Monday on the top row, brighter for busier days. Weekends come out as two dark stripes across the year, and holidays as dark notches: Christmas Day is the lowest square of its week in 40 of the 41 years. Tapping a square prints that day’s count and how far it was from yours.
The dot chart
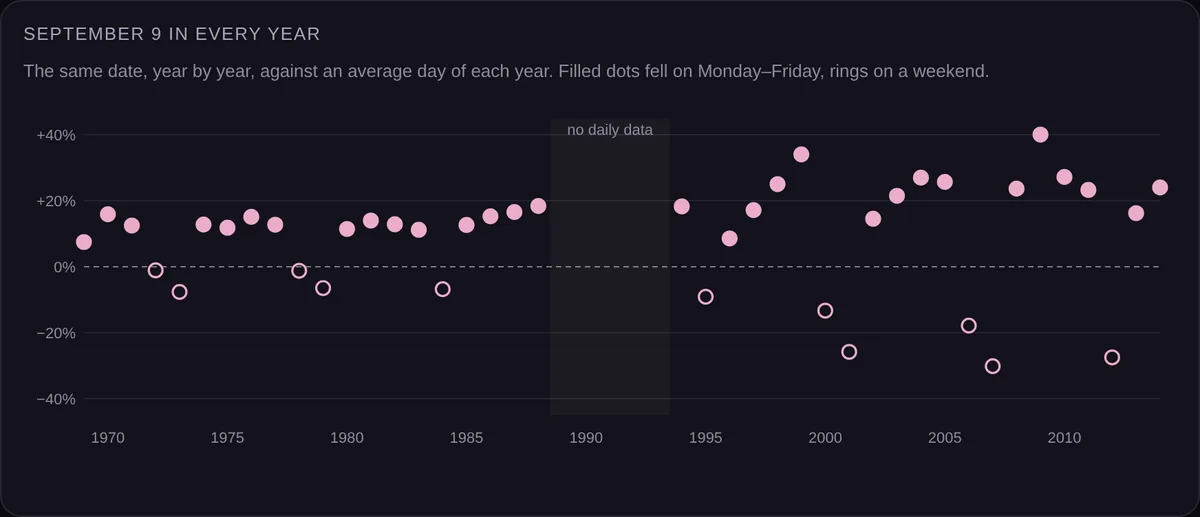
The dot chart follows your month and day through all 41 years with daily counts: filled dots for weekdays, rings for weekends, a shaded band for 1989–1993, when the public files carry no day of birth. For September 9 it splits cleanly: all 11 weekend years sit below the average line and all 30 weekday years above it, the lowest at +7%.
The list of 366 and Copy link
The list ranks every date from most to least common; its search box takes Sep 9, 12/25 or a month name, and your date is highlighted once picked. Copy link saves the date, and the year if you gave one, into a link that opens straight to the result. For which weekdays and holidays your birthday falls on in the years ahead, see the Birthday Holiday Pattern Calculator; for your sign with Ophiuchus included, the Zodiac Sign Calculator.
Sources: daily US births 1969–1988 from the National Center for Health Statistics natality files as compiled in the mosaicData package; 1994–2003 from CDC/NCHS and 2004–2014 from the Social Security Administration, both as published by FiveThirtyEight. One source per year; each day is measured against the average day of its own year. Built by Vitalii C.