Snow Day Calculator Built on the National Weather Service Forecast
Enter a ZIP for the next school morning: the official NWS winter impact level, when snow or ice falls through the night, and how much snow your area usually gets.
Loading the calculator…
Four answers for one school morning
Whether a winter morning turns into a snow day comes down to how hard the National Weather Service expects the storm to hit daily life, when the snow or ice falls, and how much snow the place normally gets. The answer at the top is built from the first two, together with any NWS winter alert; the third is shown next to them as context and is already part of the NWS impact rating. Each piece sits below the answer, so a reading that looks wrong can be traced to the part that made it.
By default the page reads the next school morning: today if it is a weekday before 7 AM, otherwise the next weekday. The two mornings after it are one tap away.
The reading follows a fixed rule, checked from the top, and the first line that fits decides. The rule is ours, written from the NWS wording; it is not an NWS product and it does not know your district’s policy. “Snow or ice in the hourly forecast” means the NWS words it as at least a chance; a slight chance never by itself lifts a morning above Watch the morning.
| Reading | When it appears |
|---|---|
| Snow-day weather | The NWS impact index shows Major or Extreme for the morning; or one of these warnings overlaps midnight to 8 AM: Winter Storm, Ice Storm, Blizzard, Lake Effect Snow, Heavy Snow, Extreme Cold or Wind Chill Warning; or the index shows Moderate and the hourly forecast has snow or ice between 5 and 8 AM. |
| Delay weather | Moderate without snow or ice in the hourly forecast for 5 to 8 AM, either because it stops before 5 AM or because the night is dry and the impact comes later or from snow already down; or freezing rain, freezing drizzle or sleet worded as at least a chance between 5 and 8 AM, at any impact level or none; or one of these over the morning: a Winter Weather, Cold Weather, Wind Chill, Freezing Rain, Freezing Drizzle or Lake Effect Snow Advisory, or a Snow Squall Warning, which lasts under an hour. |
| Watch the morning | Winter Weather Area or Minor; or any chance of snow or ice from midnight to 8 AM, including an NWS amount block with snow in those hours; or a Winter Storm, Blizzard, Ice Storm, Lake Effect Snow, Extreme Cold or Wind Chill Watch; or a source did not load. |
| Can’t read this morning | The impact index and the hourly forecast both failed to load, and no winter warning, advisory or watch came through, either because none covers the morning or because the alerts failed too. |
| No winter weather in the forecast yet | The morning is past the three days of the impact index, so there is no level for it, and the alerts and every hour of the forecast from midnight to 8 AM loaded with no snow or ice. |
| Normal school weather | The index, the alerts and every hour of the forecast from midnight to 8 AM loaded, with no level, no winter alerts and no snow or ice. |
Missing data never turns into a calm answer. If the impact index, the alerts or any hour of the forecast between midnight and 8 AM fails to load, the page says Watch the morning at best, and Can’t read this morning when the index and the hourly forecast are both missing; a winter alert still counts whenever it loads, and the status line at the bottom names the source that did not answer. Timing comes only from the hourly forecast wording; the amount blocks described below never decide whether snow falls in bus hours.
The NWS impact level
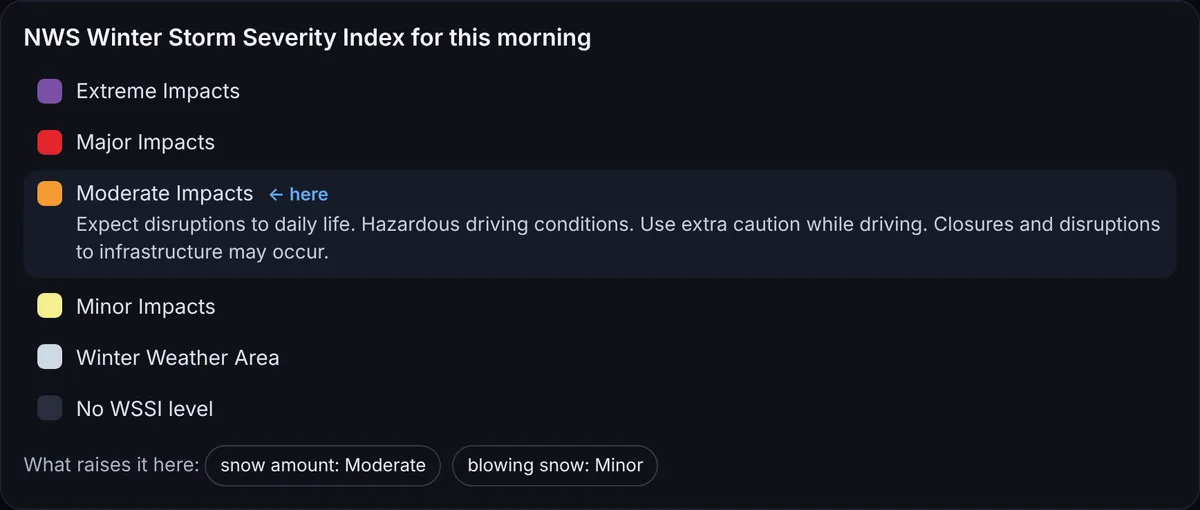
The first reason is the closest thing to an official answer to whether a storm will matter here: the Winter Storm Severity Index, which the NWS Weather Prediction Center issues every two hours for the 48 contiguous states, three days ahead. It turns the forecast into expected effects on daily life, from Winter Weather Area up to Extreme Impacts, and the marked step is the level for your ZIP on that morning. The official description of the level is printed beside it; any other step opens its own description when tapped.
Moderate is the level where the NWS text first says that closures may occur. The same service also says a Moderate rating does not mean schools have to close, which is why the ladder is one of three reasons and not the answer by itself. When the level is above zero, a row of chips shows which parts of the index raise it here: the amount of snow, heavy wet snow, ice or blowing snow.
The night strip
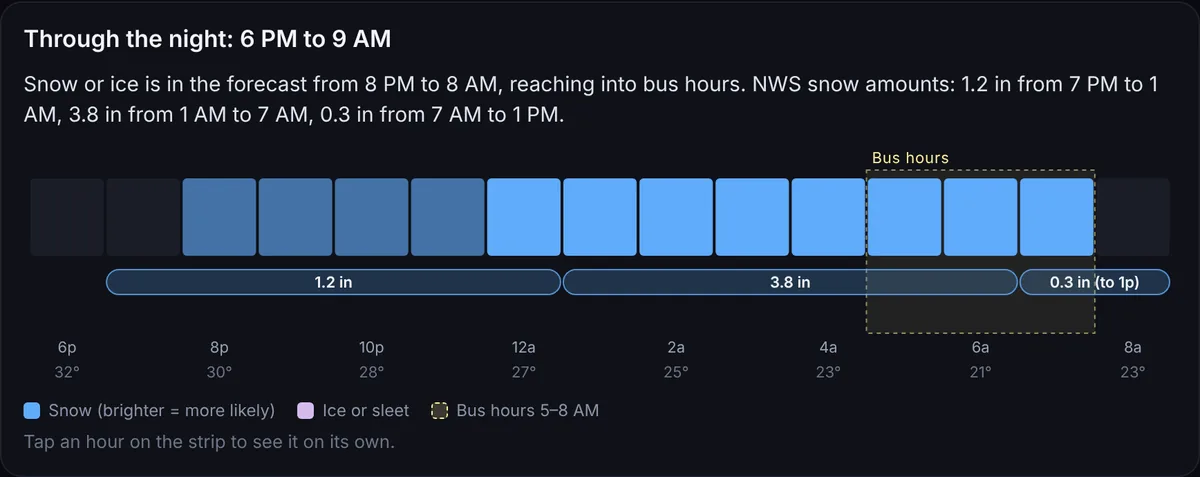
The second reason is about when, not how much. The strip runs from 6 PM to 9 AM in the local time of the ZIP. Each column is one hour: blue for snow and lilac for ice or sleet, brighter where the NWS wording moves from a slight chance to likely. The dashed band marks 5 to 8 AM, the hours when buses are on the road and districts usually announce their call. Temperatures run along the bottom.
Snow and ice amounts are drawn as bars, one bar per NWS block. The forecast gives amounts in blocks of about six hours, so a bar reading 3.8 in from 1 AM to 7 AM means exactly that and nothing finer; the page does not split it into hours or invent a total for 6 AM. A bar that starts before 6 PM or ends after 9 AM says so in its label.
Tapping an hour opens it on its own: the snow or ice wording for that hour, the temperature and the wind chill, whether it falls in bus hours, and which amount block it belongs to. Timing is what separates the two middle readings. Snow that ends at 3 AM leaves road crews hours before the first bus, while the same amount still falling at 6:30 AM lands on the drive itself.
How much snow your area usually gets
The third reason puts the forecast next to the 1991–2020 NOAA climate normals for the nearest station that records snowfall: the average snow in a year and the average number of days a year with at least 1, 3, 5 and 10 inches. Each ZIP is matched to one of 5,303 stations in the 48 states, half of them within 13 km of the ZIP’s center, and the station’s name and distance are printed under the numbers. When the forecast has an inch or more, a line adds up only the NWS blocks that fall entirely between 6 PM and 9 AM and says how often a day of that size comes at the station.
The same storm means very different things in different places. A ZIP in downtown Raleigh reads a station that averages 4.5 inches of snow a year and a 3-inch day 0.8 times a year, so a 3-inch morning there comes less than once a winter on average. Downtown Buffalo reads the airport station at 95.4 inches a year and 9.1 such days. The NWS index already gives more weight to snow where snow is rare; the numbers here show why.
When the NWS issues a winter alert
The alerts box lists only winter alerts from the NWS whose time covers midnight to 8 AM: warnings, advisories and watches for winter storms, ice, blizzards, lake-effect snow and extreme cold. A freeze watch for gardeners or a warning that ends the evening before does not count. Each alert opens to the full NWS text, the office that issued it and a link to the alert on the NWS site.
Where the numbers come from
The forecast is never stored here: every time a ZIP is entered, your browser asks the NWS directly. Only the fixed parts are prepared in advance, the ZIP points and the station normals, which this site serves as small files. The status line under the result shows each source on its own, the hourly forecast with its update time, the impact index, the alerts and the snowfall normal, and Copy link keeps the ZIP in the address so the same morning opens on another phone. The sources are the gridded forecast and alerts from api.weather.gov and the Winter Storm Severity Index from the NWS map service of the Weather Prediction Center. ZIP points come from the 2025 Census ZCTA Gazetteer, which has no entries for ZIPs that are only PO boxes or single buildings. The impact index covers the contiguous United States only, so Alaska, Hawaii and the territories are not read here. Studies of school closures, such as the University of Richmond’s work with Virginia district records, find that districts in less snowy places cancel for less snow; the final call always belongs to the district.
Sources: NWS Weather Prediction Center: Winter Storm Severity Index; National Weather Service API; NOAA NCEI U.S. Climate Normals 1991–2020; U.S. Census Bureau Gazetteer Files; Winter Weather and School Cancellation in Virginia (University of Richmond). More on this site: when a child can go back to school after a fever.
Built by Vitalii C.